IBM Data Science Experience
An end-to-end experience for data scientists to research, create, and collaborate.
Data Science Experience won the Red Dot Design Award 2017 in the Platform as a Service category, and was nominated for a Webby Award in 2018 for Best Use of Machine Learning.

Problem
Current data science tools and resources are fragmented—resulting in a disjointed experience and making it difficult for both aspiring and experienced data scientists to effectively work with data.
Solution
IBM’s Data Science Experience (DSX) is an end-to-end experience that aims to unify data scientists’ workflows—allowing them to easily reference relevant and validated resources, use preferred data science tools, and add effective collaboration to their workflow.
We began devising a solution in February 2016, and this documents our work from initial research to limited release. The project is continually ongoing as we work toward our final vision.
Roles
Conducting interviews
Leading competitive analysis
Sketching/storyboarding
Wireframing/mockups
Prototyping
User testing
Animating interactions
Presenting concepts and research to executives
Collaborators
10-person IBM San Francisco design team:
1 visual designer
2 UX researchers
2 design leads
5 UX designers

What is Data Science?
In order to learn about data science, we needed to understand the people, the tools, and the workflow. Together with the research team from other Analytics Platforms studios, we gathered data from over 50 data professionals to fully understand and empathize with our target audience.
11 Data Engineers
48 Data Scientists
10 Business Analysts
17 App Developers
87 interviews
37 usability evaluation sessions
13 conferences and meetups
9 site visits and contextual inquiries


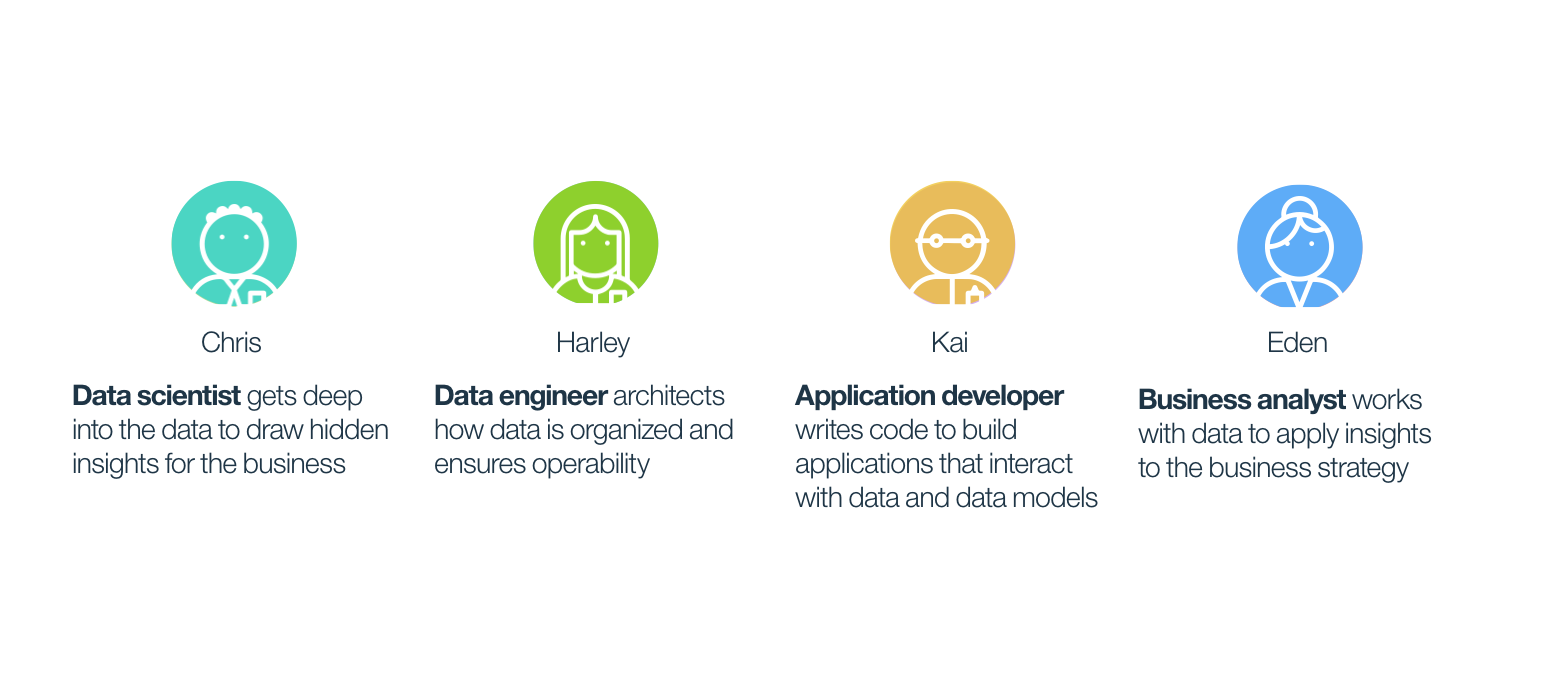
Personas
We soon came to learn that the role of data scientist is very diverse and sophisticated. Based on our interviews and observations, we narrowed down the roles that different data professionals fall into and identify as. Our product aims at not just addressing the data scientist, but the other personas who work and think in similar ways.
Competitive Analysis
Next we looked at several products in related fields and asked our internal data scientists to plot each of them according to their complexity and the amount of community involvement users could partake in. We then interviewed the participants in order to validate some of our assumptions about their use of these tools:
When is each product used in the data science process?
What are the pros and cons of each product?
What is it like to be a member of the community for a given product?

Data Science Workflow
Our research led us to realize we needed a clearer picture of the full data science process to target the main pain points and opportunity spaces. Utilizing quotes from the interviews and observations from the contextual inquiries, our team pieced together a flow diagram showing the cyclical process of a data science project from start to finish. This evolved into an As-Is Scenario Diagram highlighting the major pain points that came about from research synthesis.

Pain Points
We narrowed the pain points down to three key ones:
Difficult to Find Reliable Resources: Data Scientists have to spend a lot of time combing the internet for resources—research papers, academic algorithms—and determine if they are trustworthy.
Fragmented Experience: Current attempts to unify the data science tools available for users to choose specific platforms. There isn't one central environment that allows data scientists to use the tools and languages of their choice, and data scientists spend precious time having to learn a new tool instead of diving straight into analytics and modeling.
Collaboration: Data scientists find it difficult to understand and pick up a project where another data scientist had left off. Also, many companies hire a small number of data scientists, making it hard for one to find a colleague for feedback.

Storyboards
Each member of our team brainstormed several high-level ideas in the form of stories. We then narrowed them down to three concepts based on how well they addressed the pain points from our research. From these, we created storyboards showcasing how a data scientist could research, experiment, and collaborate.


For these storyboards we picked four characters who encapsulated more detailed archetypes of the data scientist and the data engineer personas. The three storyboards each focused on one pain point:
Research tackles the problem of finding reliable resources
Experiment addresses the fragmented experience
Collaborate solves the problem of understanding another data scientist's work
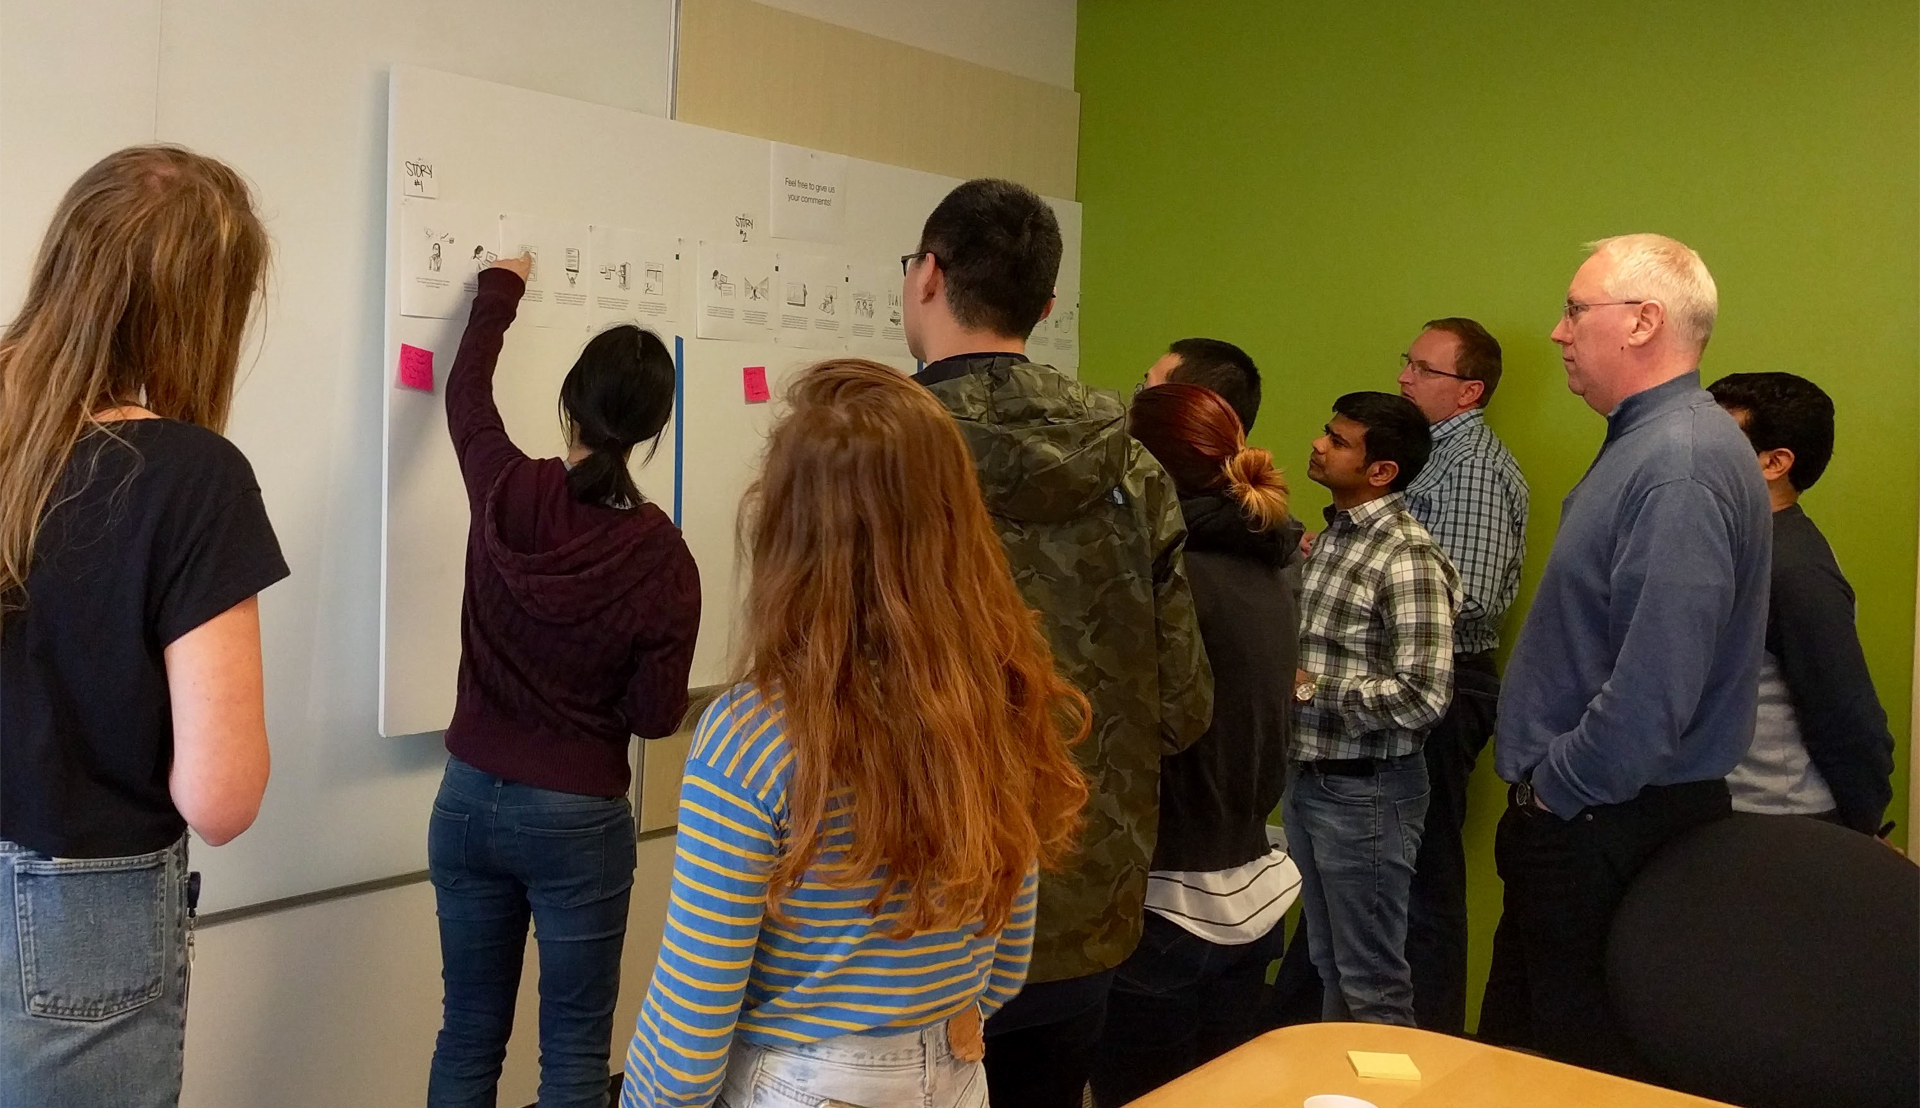
I then helped conduct a storyboard validation workshop with 13 participants to test the validity of these stories with data scientists.
We gathered a team of data scientists and engineers and asked them to provide their thoughts of the storyboards and whether any resonated with them. They gave us personal experiences and feedback to drive our designs to the next stage.
Sketches
Working from the storyboards, we partook in several sessions of blue sky brainstorming, creating sketches around the three areas of research, experimentation, and collaboration for data scientists.

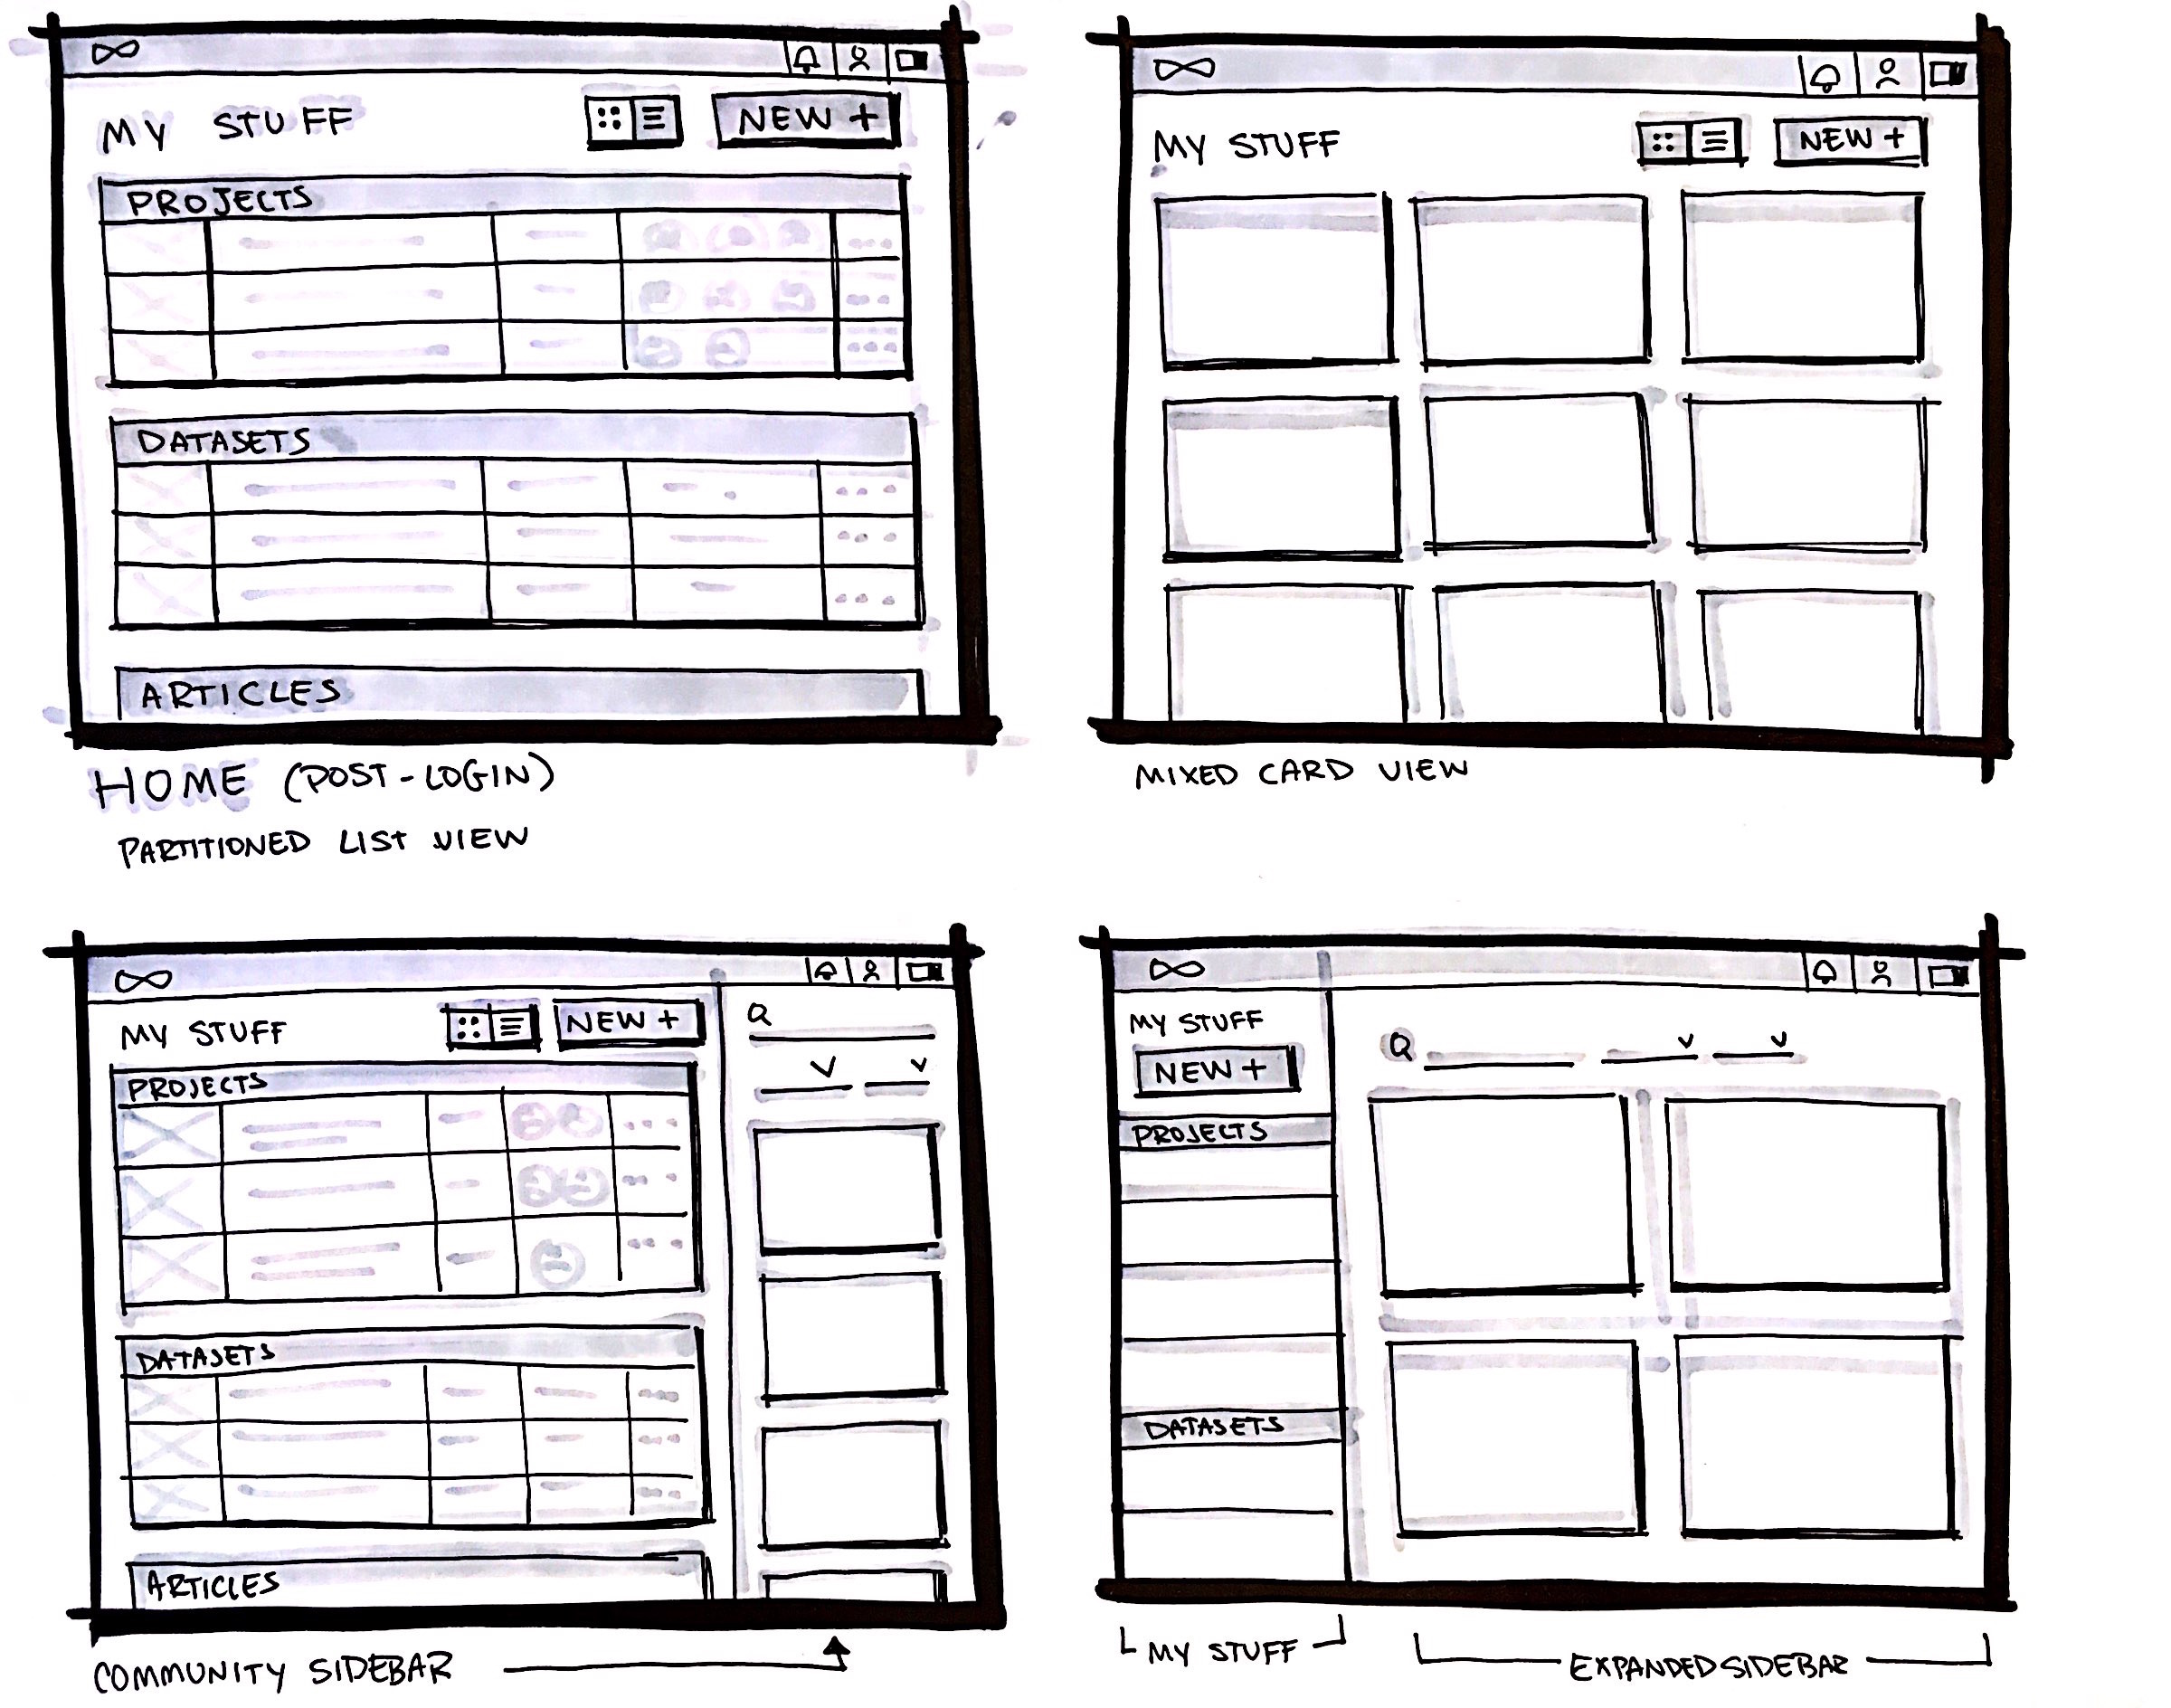


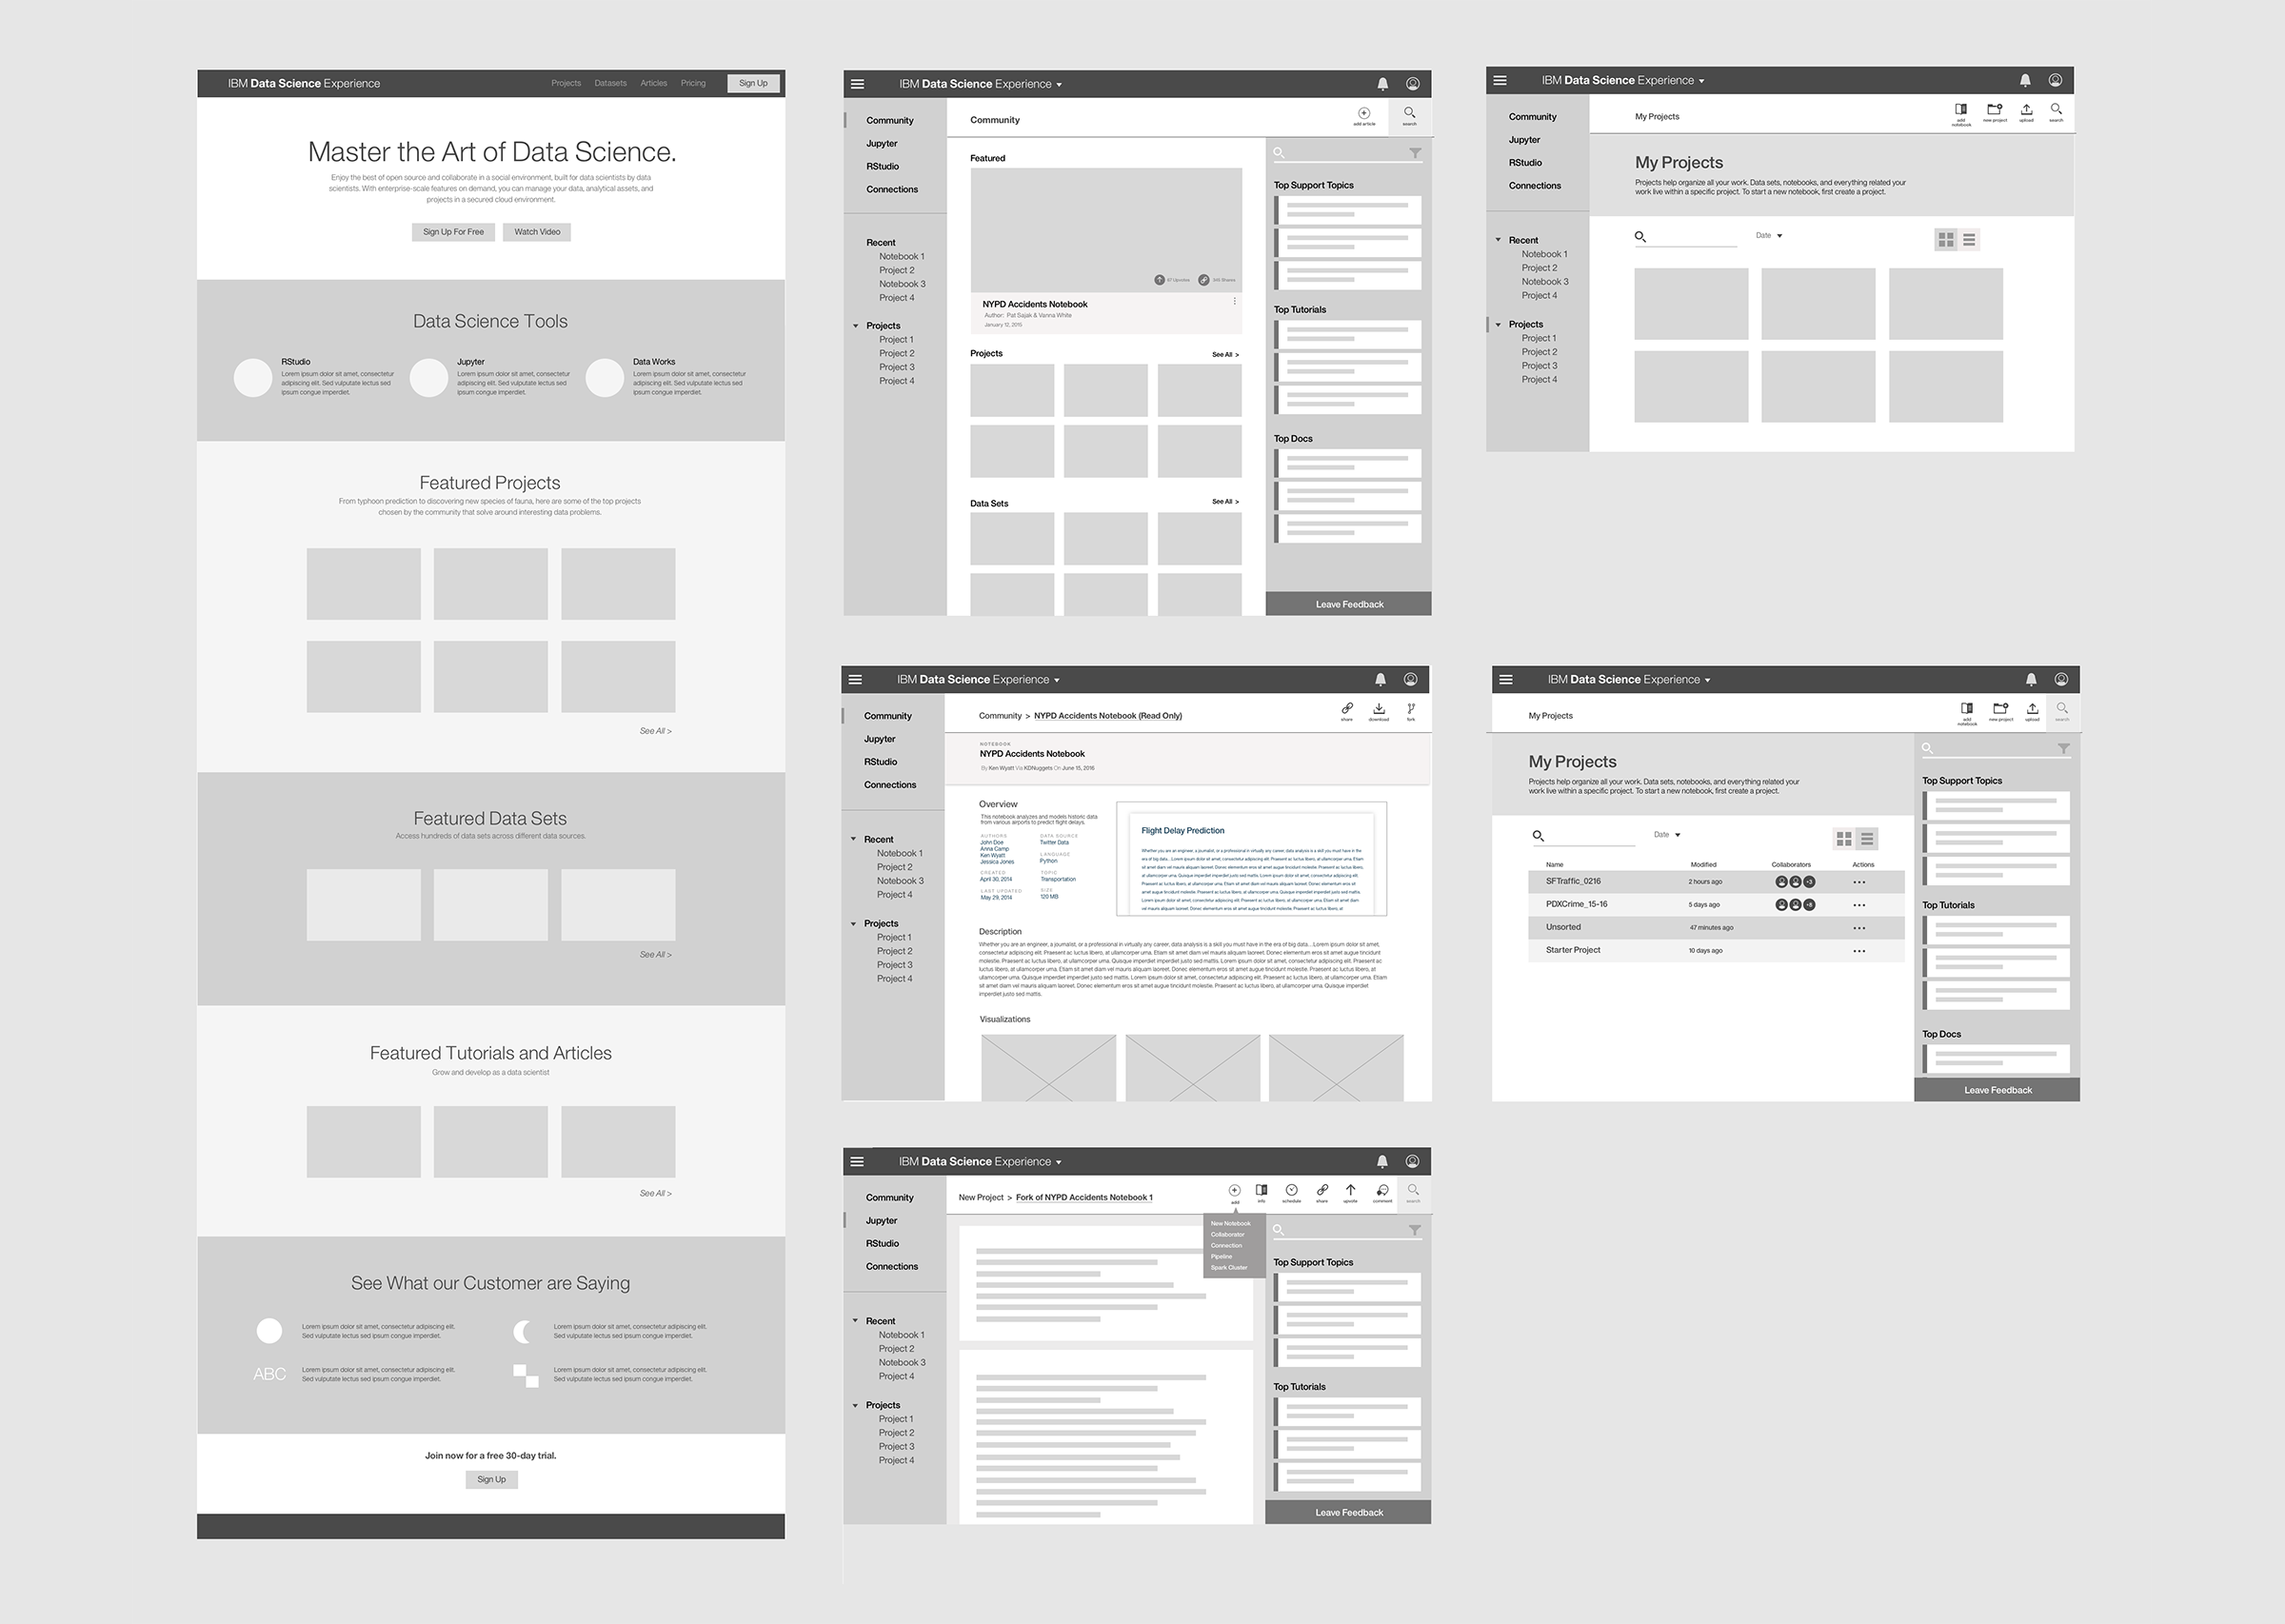
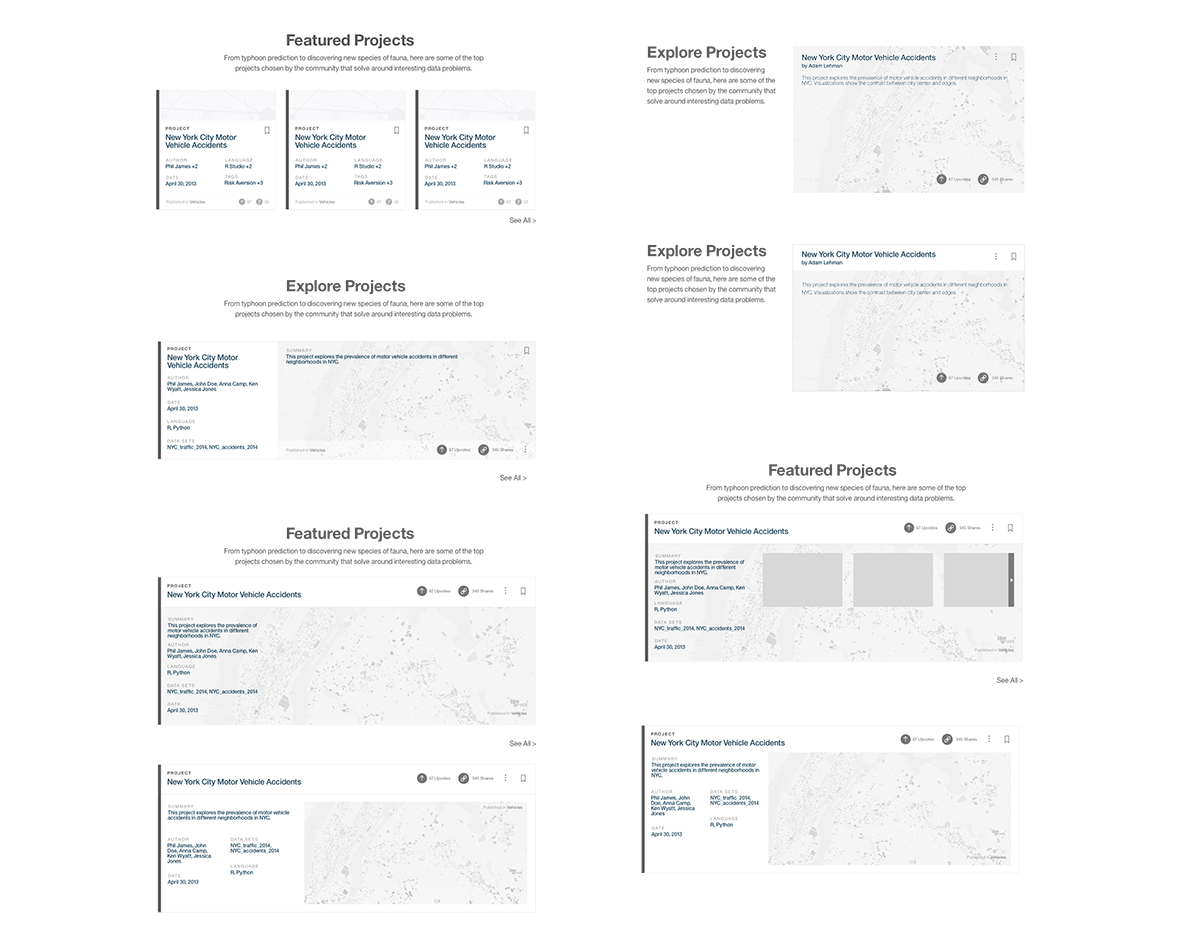
Wireframes
Our design team was then divided into three squads to dive deeper into the respective areas of data research, experimentation, and collaboration for data scientists. We converged our efforts weekly.

User Testing
Throughout the wireframing and convergence processes, we constantly tested with internal data scientists through semi-structured usability testing sessions. We were able to pinpoint strengths/weaknesses of each design.

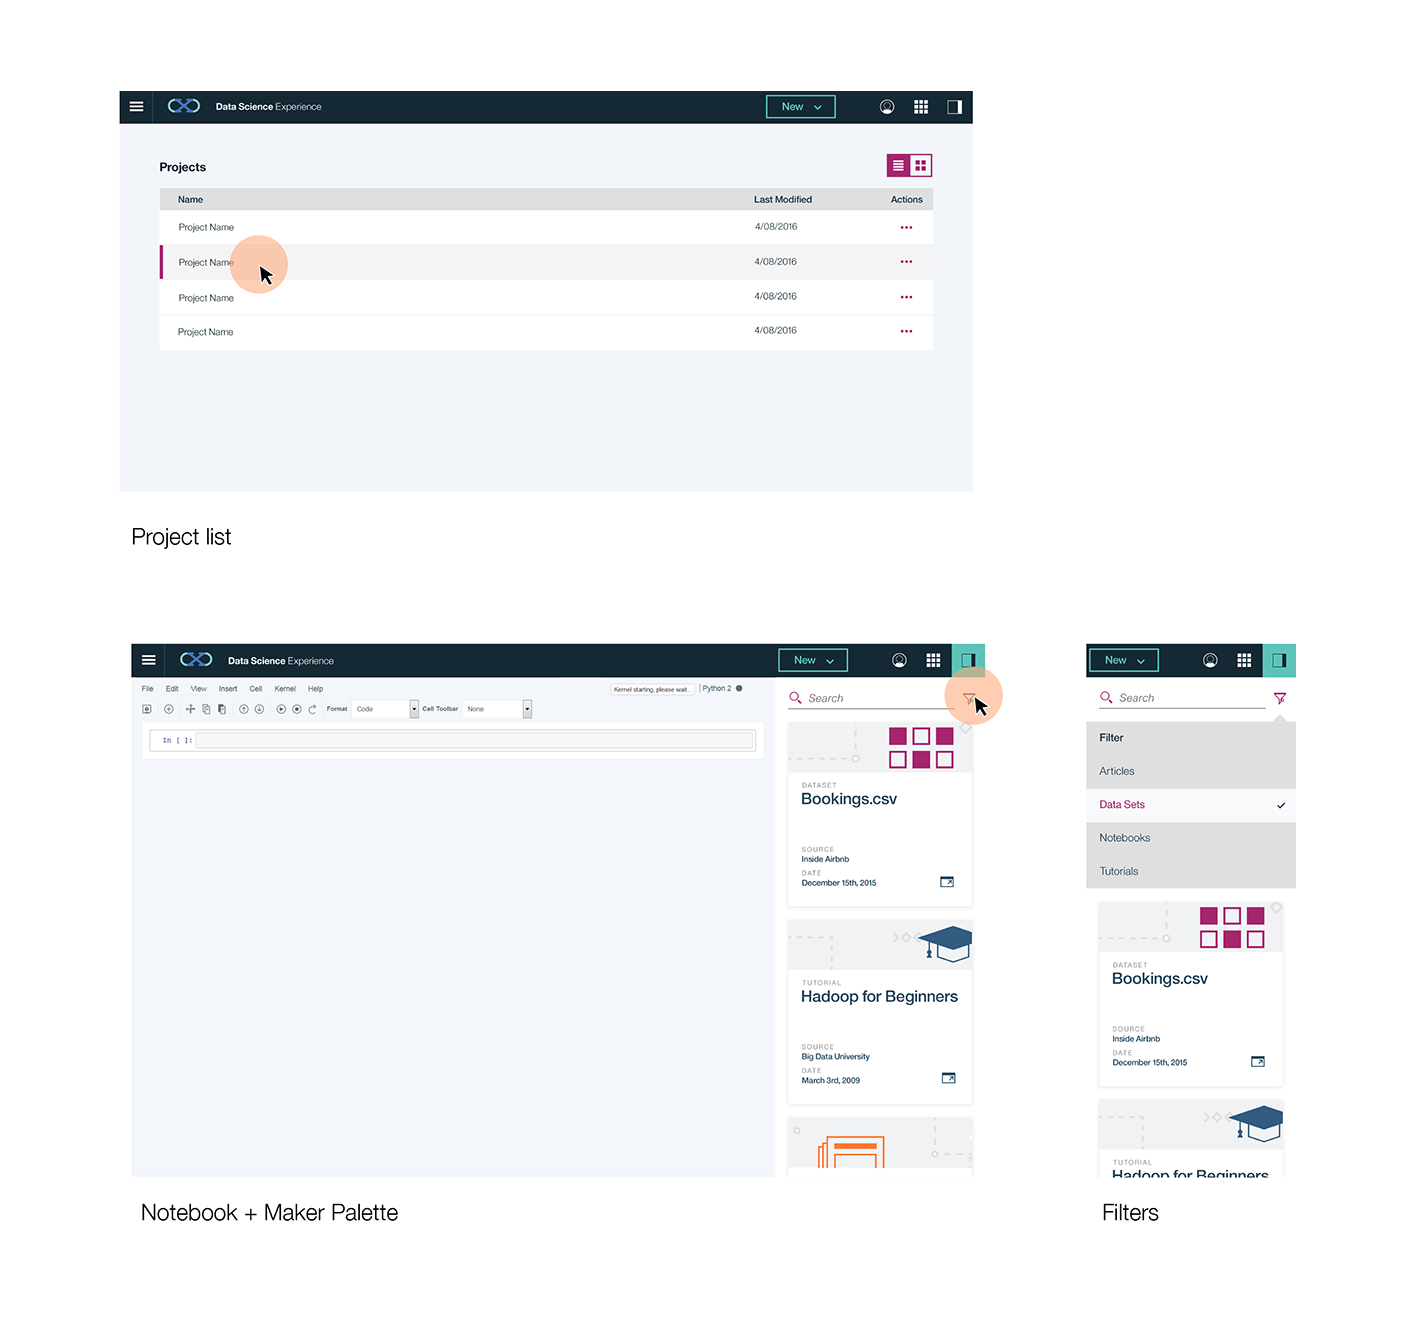
Prototypes & Hi-Fi Mock-Ups
The user testing informed and validated several design decisions, leading to prototypes. I built several clickable prototypes in Axure as well as interaction mockups in Adobe After Effects. These prototypes were also tested on users.


Motion Design
For the pre-login webpage, I created promotional animations using Adobe After Effects.


Launch
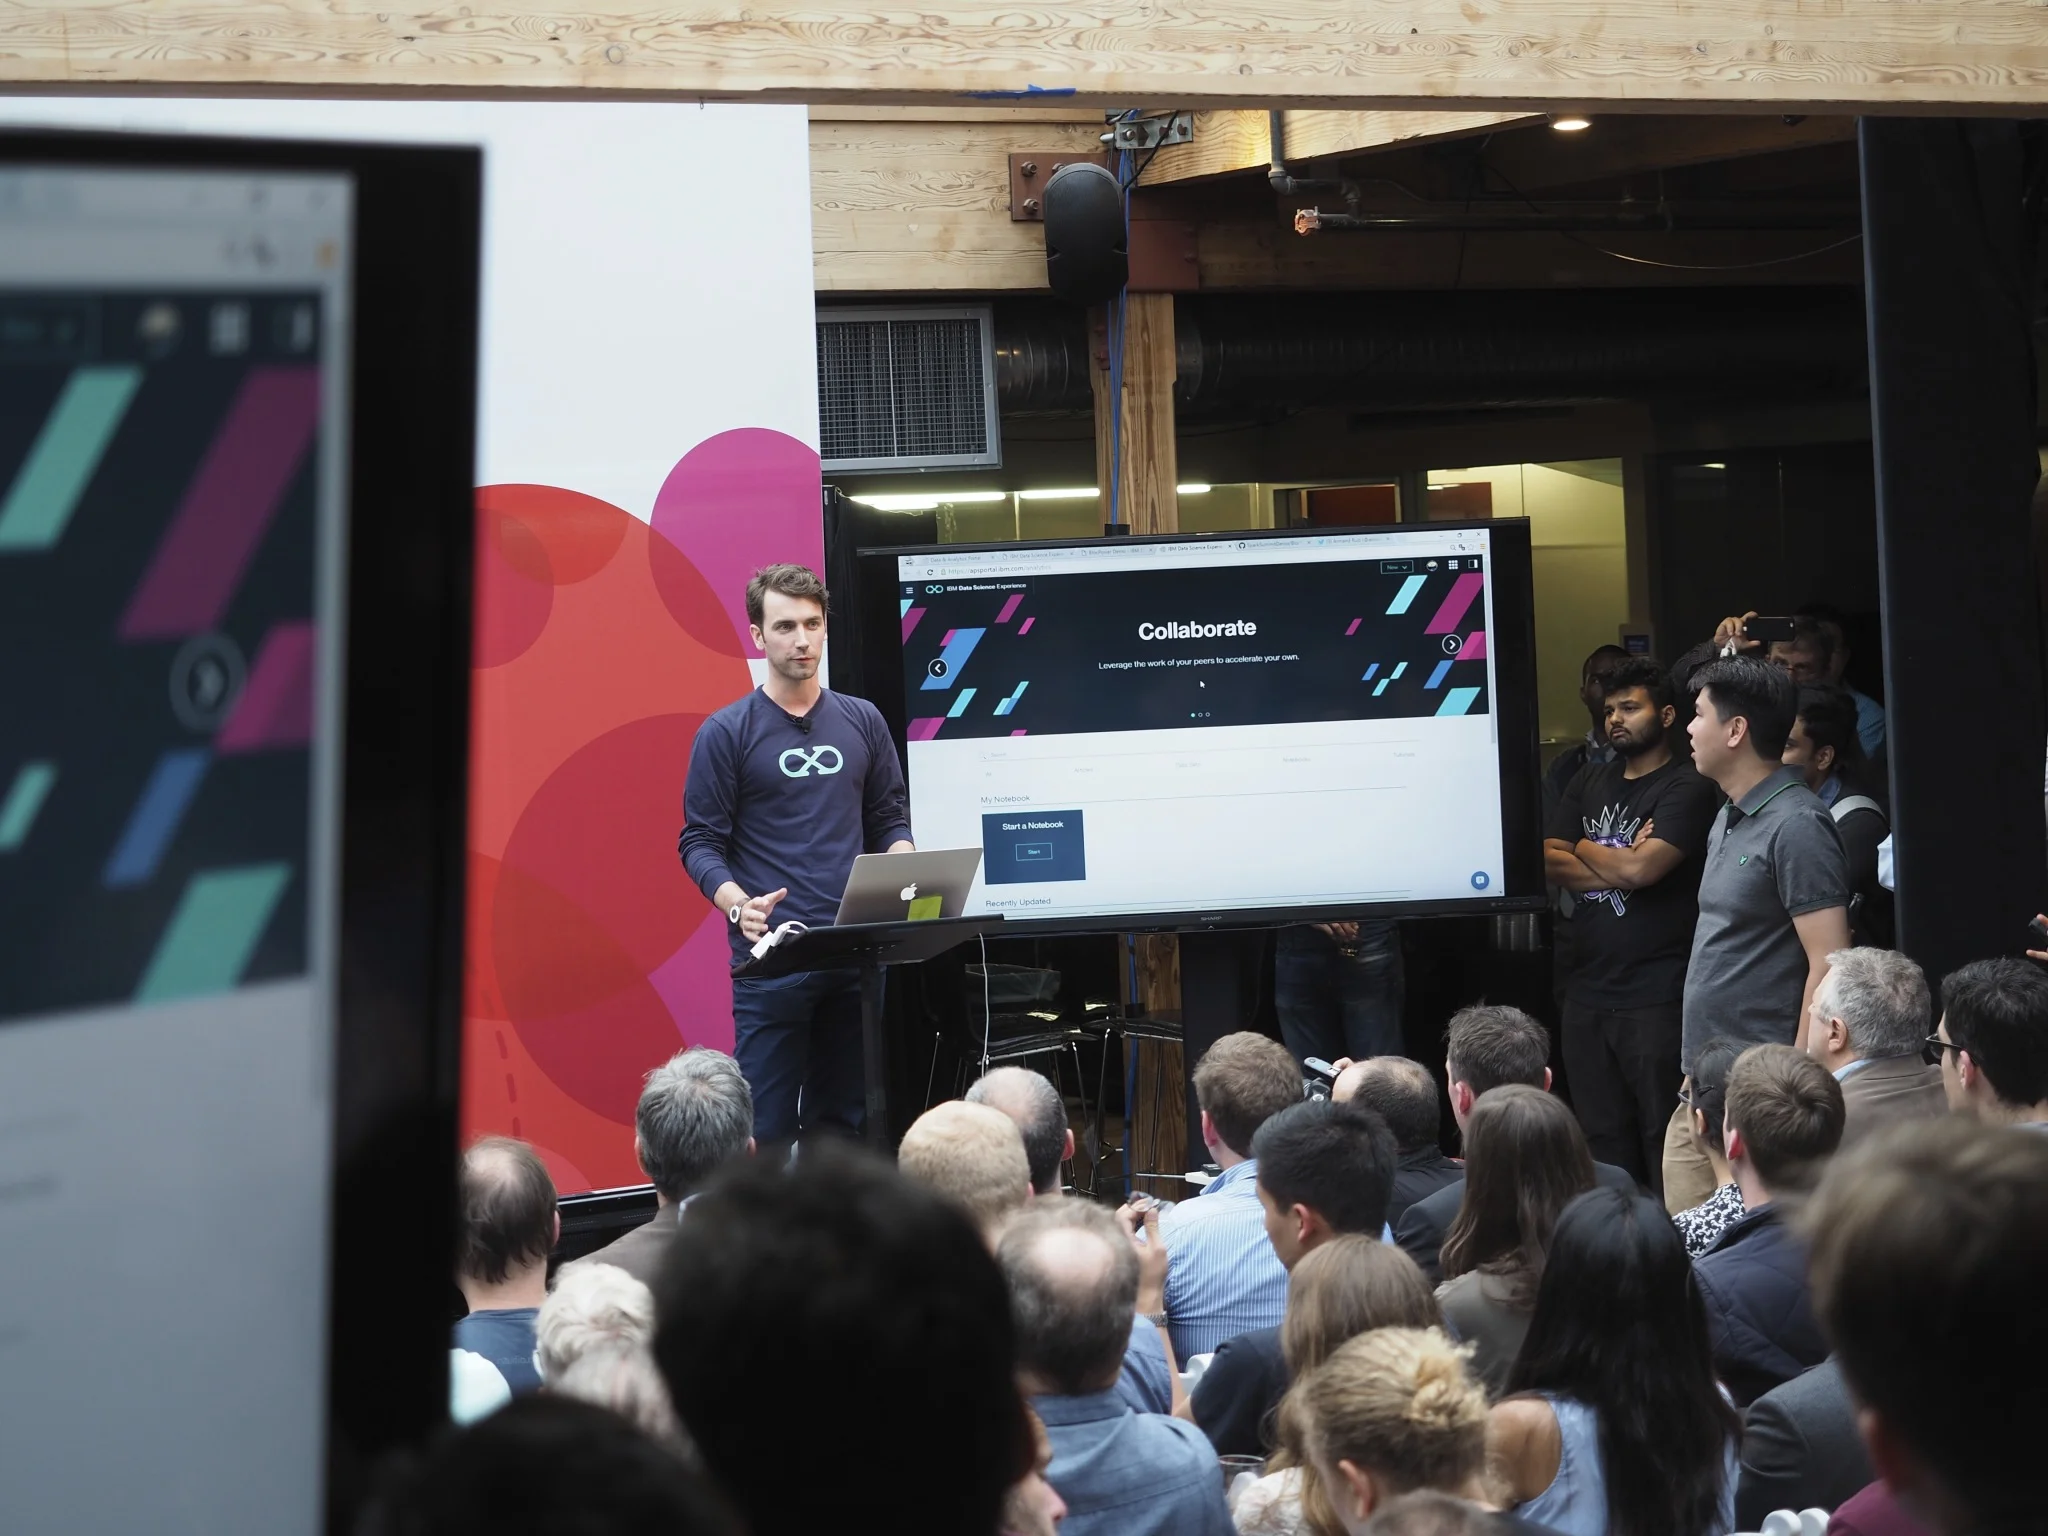
IBM Data Science Experience was officially announced and demoed at the Apache Spark Maker Community Event on June 6th, 2016.
Promotional Video